fitcircle
- 官方文档
- 简介
拟合球面上数据点的平均位置及圆弧
该命令从输入数据的前两列读取经纬度数据,将其转换为单位球面上的笛卡尔三维矢量,然后计算输入坐标数据的平均位置以及可以拟合这些坐标点的大圆路径的pole。
必选选项
- table
输入数据
-Lnorm
-L1解法1
-L2解法2
-L或-L3同时输出解法1和解法2的结果在计算输入坐标的均值和大圆弧pole时有两种计算方法,分别用
-L1和-L2表示。当数据沿着某个大圆弧且距离接近时,两组解结果相似。若数据较分散,则大圆弧的pole要比均值不精确得多。此时可以比较两组结果以作为相互的验证。The -L1 solution is so called because it approximates the minimization of the sum of absolute values of cosines of angular distances. This solution finds the mean position as the Fisher average of the data, and the pole position as the Fisher average of the cross-products between the mean and the data. Averaging cross-products gives weight to points in proportion to their distance from the mean, analogous to the “leverage” of distant points in linear regression in the plane.
The -L2 solution is so called because it approximates the minimization of the sum of squares of cosines of angular distances. It creates a 3 by 3 matrix of sums of squares of components of the data vectors. The eigenvectors of this matrix give the mean and pole locations. This method may be more subject to roundoff errors when there are thousands of data. The pole is given by the eigenvector corresponding to the smallest eigenvalue; it is the least-well represented factor in the data and is not easily estimated by either method.
选项
- -Ff|m|n|s|c
控制输出格式。
正常情况下,该命令会将计算结果以较复杂的形式输出。使用
-F选项,则只返回简单的坐标。-F后可以加上其他修饰符以指定要返回的坐标:fFlat Earth mean locationmmean locationnnorth pole of great circlessouth pole of great circlecpole of small circle and its colatitude, which requires-S
- -Slat
拟合小圆弧而不是大圆弧
The pole will be constrained to lie on the great circle connecting the pole of the best-fit great circle and the mean location of the data. Optionally append the desired fixed latitude of the small circle [Default will determine the latitude].
示例
如下命令,用两种计算方法拟合了数据的大圆弧路径和小圆弧路径,并借助 project 生成路径坐标。
#!/usr/bin/env bash
# test/fitcircle/circles.sh
#
# Tests gmt fitcircle on spherical data points

ps=fitcircle_ex1.ps

# Fit great circle to red points and small circle to green points
# Plot the best-fitting great and small circles as well as the
# location of the mean locations and pole locations for both
# the -L1 and -L2 options (i.e., -L3).

gmt fitcircle gcircle.txt -L3 > g.txt
gmt fitcircle scircle.txt -L3 -S > s.txt
gpole1=`grep "L1 N Hemisphere" g.txt | gawk '{printf "%s/%s\n", $1, $2}'`
gpole2=`grep "L2 N Hemisphere" g.txt | gawk '{printf "%s/%s\n", $1, $2}'`
spole1=`grep "L1 Small Circle Pole" s.txt | gawk '{printf "%s/%s\n", $1, $2}'`
spole2=`grep "L2 Small Circle Pole" s.txt | gawk '{printf "%s/%s\n", $1, $2}'`
slat1=`grep "L1 Small Circle" s.txt | gawk '{print 90-$NF}'`
slat2=`grep "L2 Small Circle" s.txt | gawk '{print 90-$NF}'`
gmt psxy -Rg -JG-30/40/7i -P -Bg -K gcircle.txt -Sc0.04i -Gred -Xc -Yc > $ps
gmt psxy -R -J -O -K scircle.txt -Sc0.04i -Ggreen >> $ps
gmt project -G1 -T$gpole1 -L-180/180 | gmt psxy -R -J -O -K -W3p >> $ps
gmt project -G1 -T$gpole2 -L-180/180 | gmt psxy -R -J -O -K -W1p,- >> $ps
gmt project -G1/$slat1 -T$spole1 -L-180/180 | gmt psxy -R -J -O -K -W3p >> $ps
gmt project -G1/$slat2 -T$spole2 -L-180/180 | gmt psxy -R -J -O -K -W1p,- >> $ps
grep "Great Circle Pole" g.txt | gmt psxy -R -J -O -K -Sa0.2i -Gred -W0.25p >> $ps
grep "Small Circle Pole" s.txt | gmt psxy -R -J -O -K -Sa0.2i -Ggreen -W0.25p >> $ps
grep "L1 Average" g.txt | gmt psxy -R -J -O -K -Sa0.2i -Gyellow -W0.25p >> $ps
grep "L2 Average" g.txt | gmt psxy -R -J -O -K -Sa0.2i -Gyellow -W0.25p >> $ps
grep "L1 Average" s.txt | gmt psxy -R -J -O -K -Sa0.2i -Gyellow -W0.25p >> $ps
grep "L2 Average" s.txt | gmt psxy -R -J -O -K -Sa0.2i -Gyellow -W0.25p >> $ps
gmt psxy -R -J -O -T >> $ps
rm g.txt s.txt gmt.*
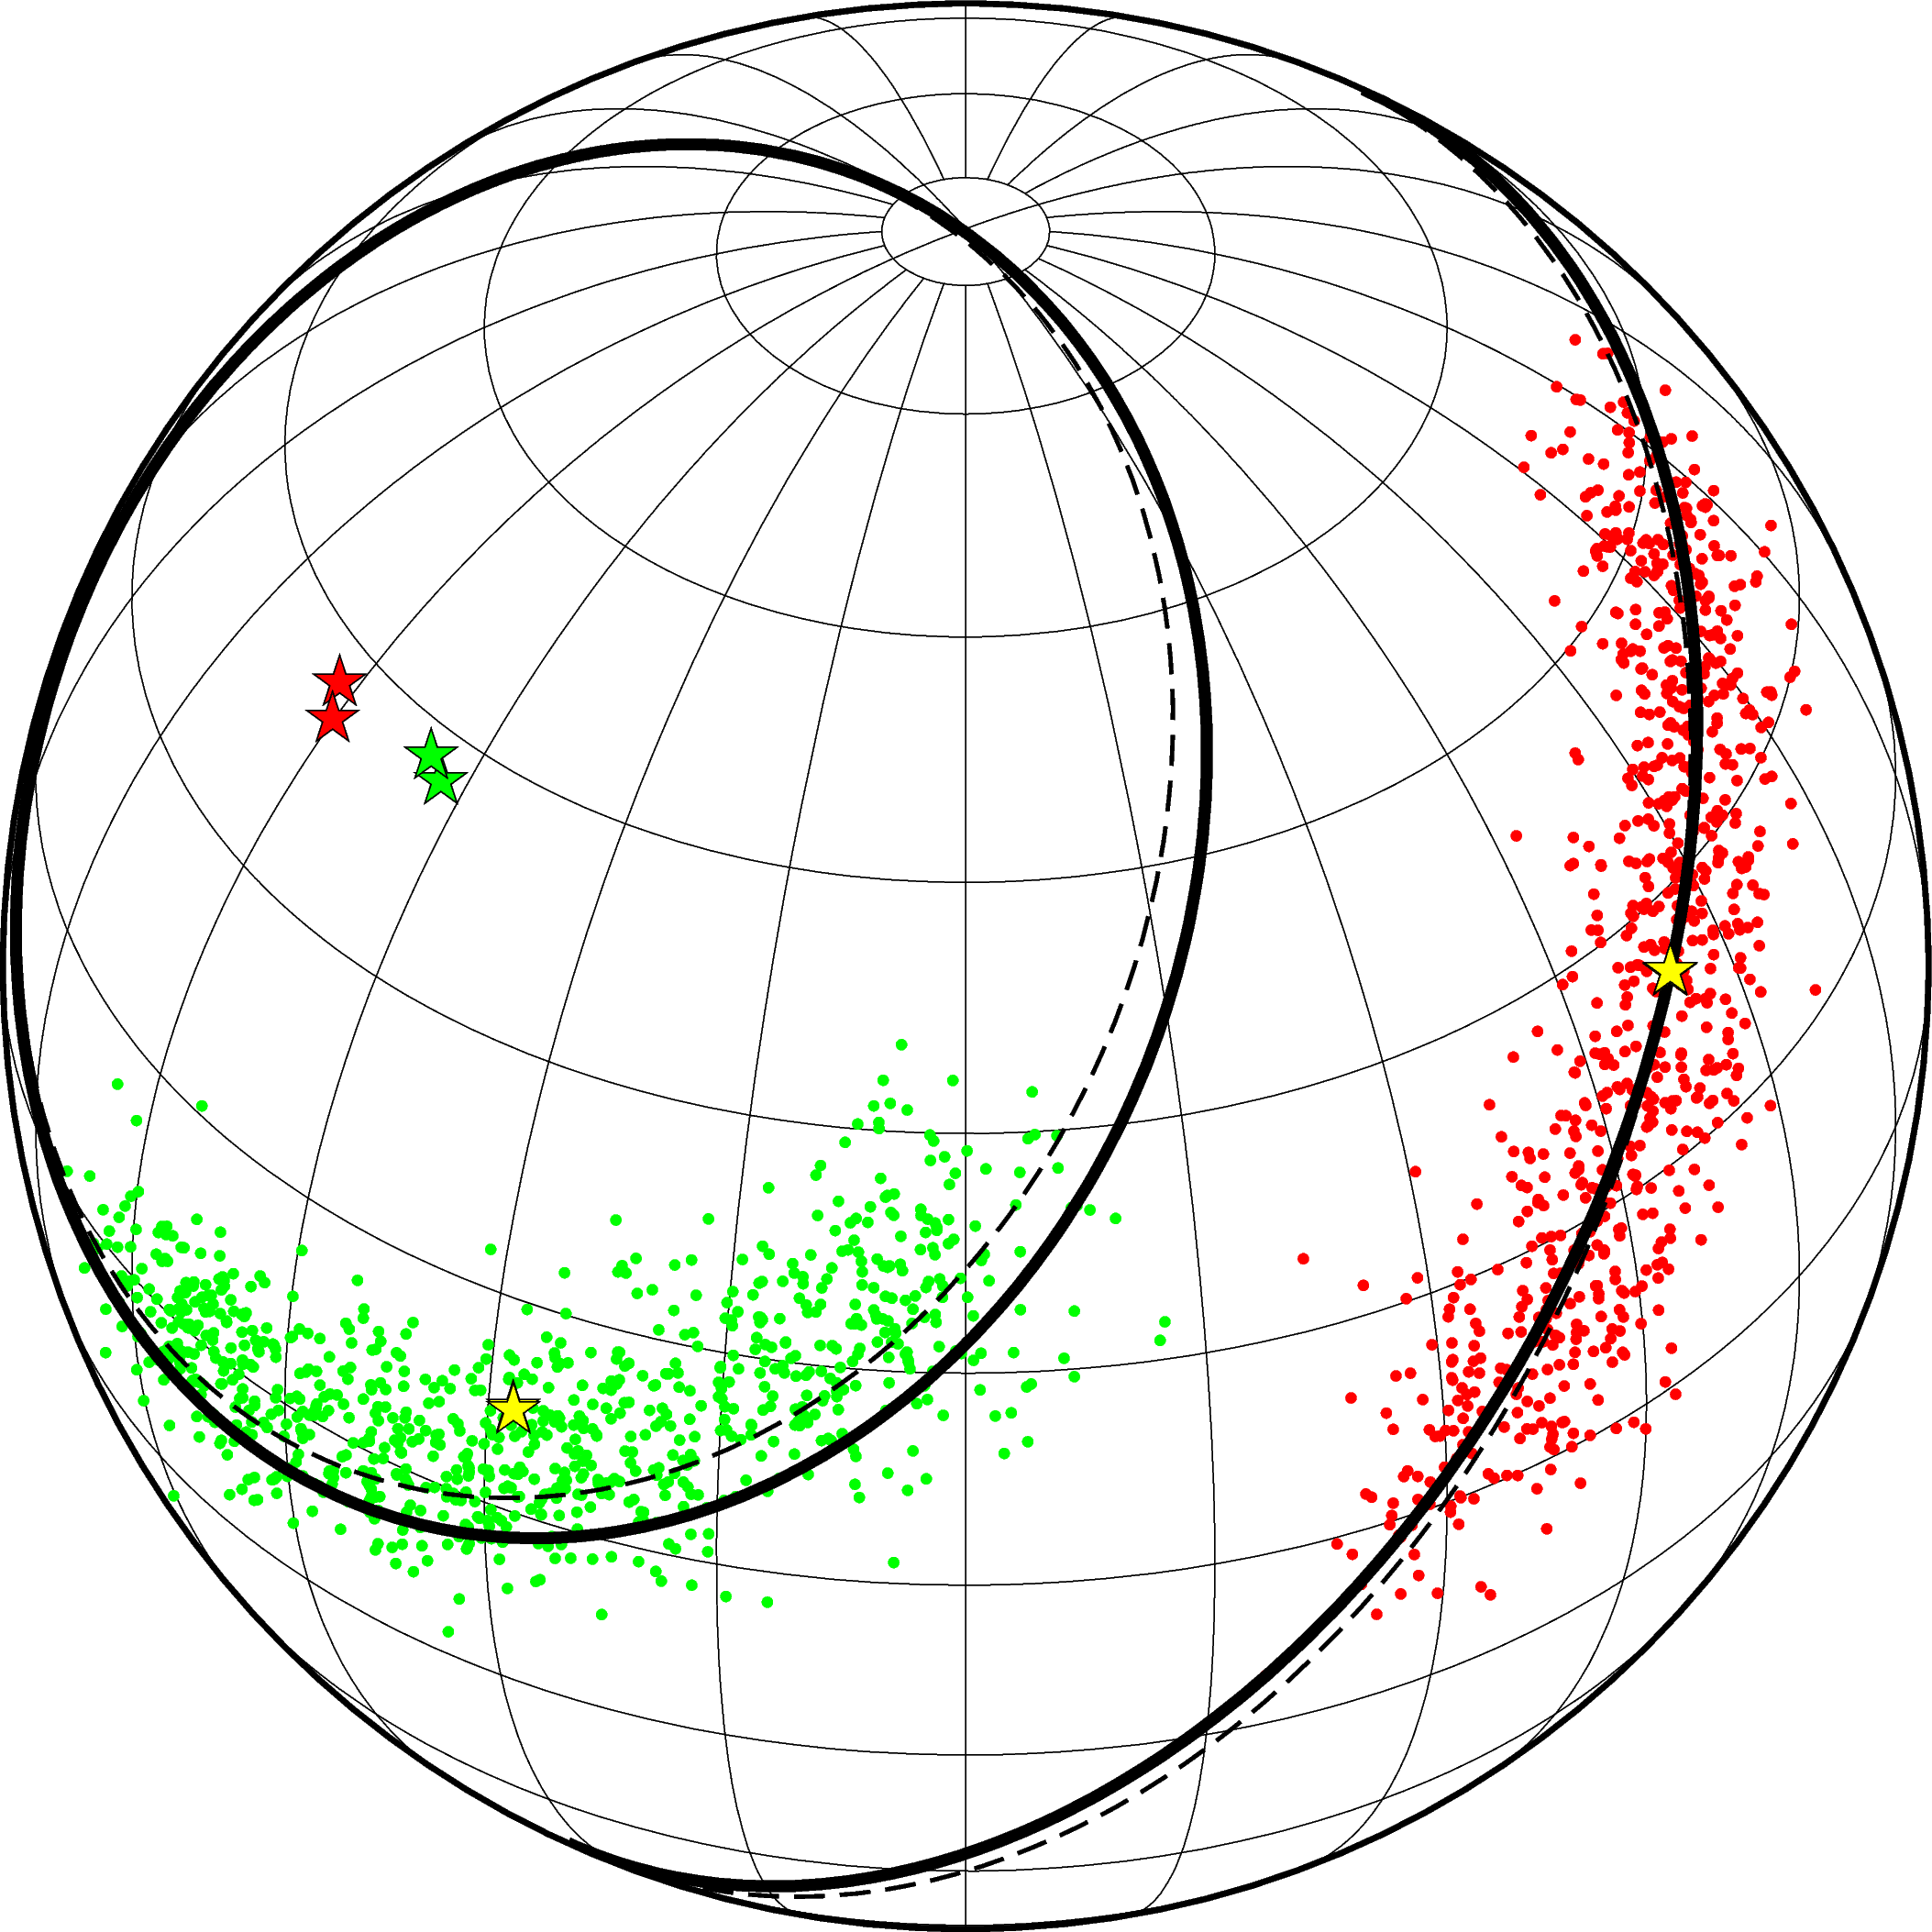
fitcircle示例