理解图层
在前面几节中,我们已经学会了如何使用 GMT 绘制底图、海岸线、线段、符号、文字、地形起伏等等。这一节我们将把前面学到的内容综合起来,试着去绘制下面这张地震学经常见到的大圆弧路径图。在这一过程中,我们将试着去理解 GMT 中图层的概念。
图件分析与拆解
上面这张图看上去有些复杂,实际上是由很多部分构成的。将整张图拆解一下可知,上图由如下几个部分构成:
地形起伏作为底图
震中位置(五角星)
台站位置(三角形)
射线路径(图中大圆弧)
台站名(文字)
这几个部分,在教程的前几节都已经做过介绍,因而只需要将前几节的内容综合起来即可。
绘制底图
我们首先使用 grdimage 模块绘制底图,并使用 colorbar 模块添加色标:
#!/usr/bin/env bash
gmt begin layers

# Plot basemap and Earth relief
gmt basemap -JH180/15c -Rg -B0
gmt grdimage @earth_relief_30m -Cetopo1 -I+d
gmt colorbar -Bxa2000f+l"Elevation (m)"
gmt end show

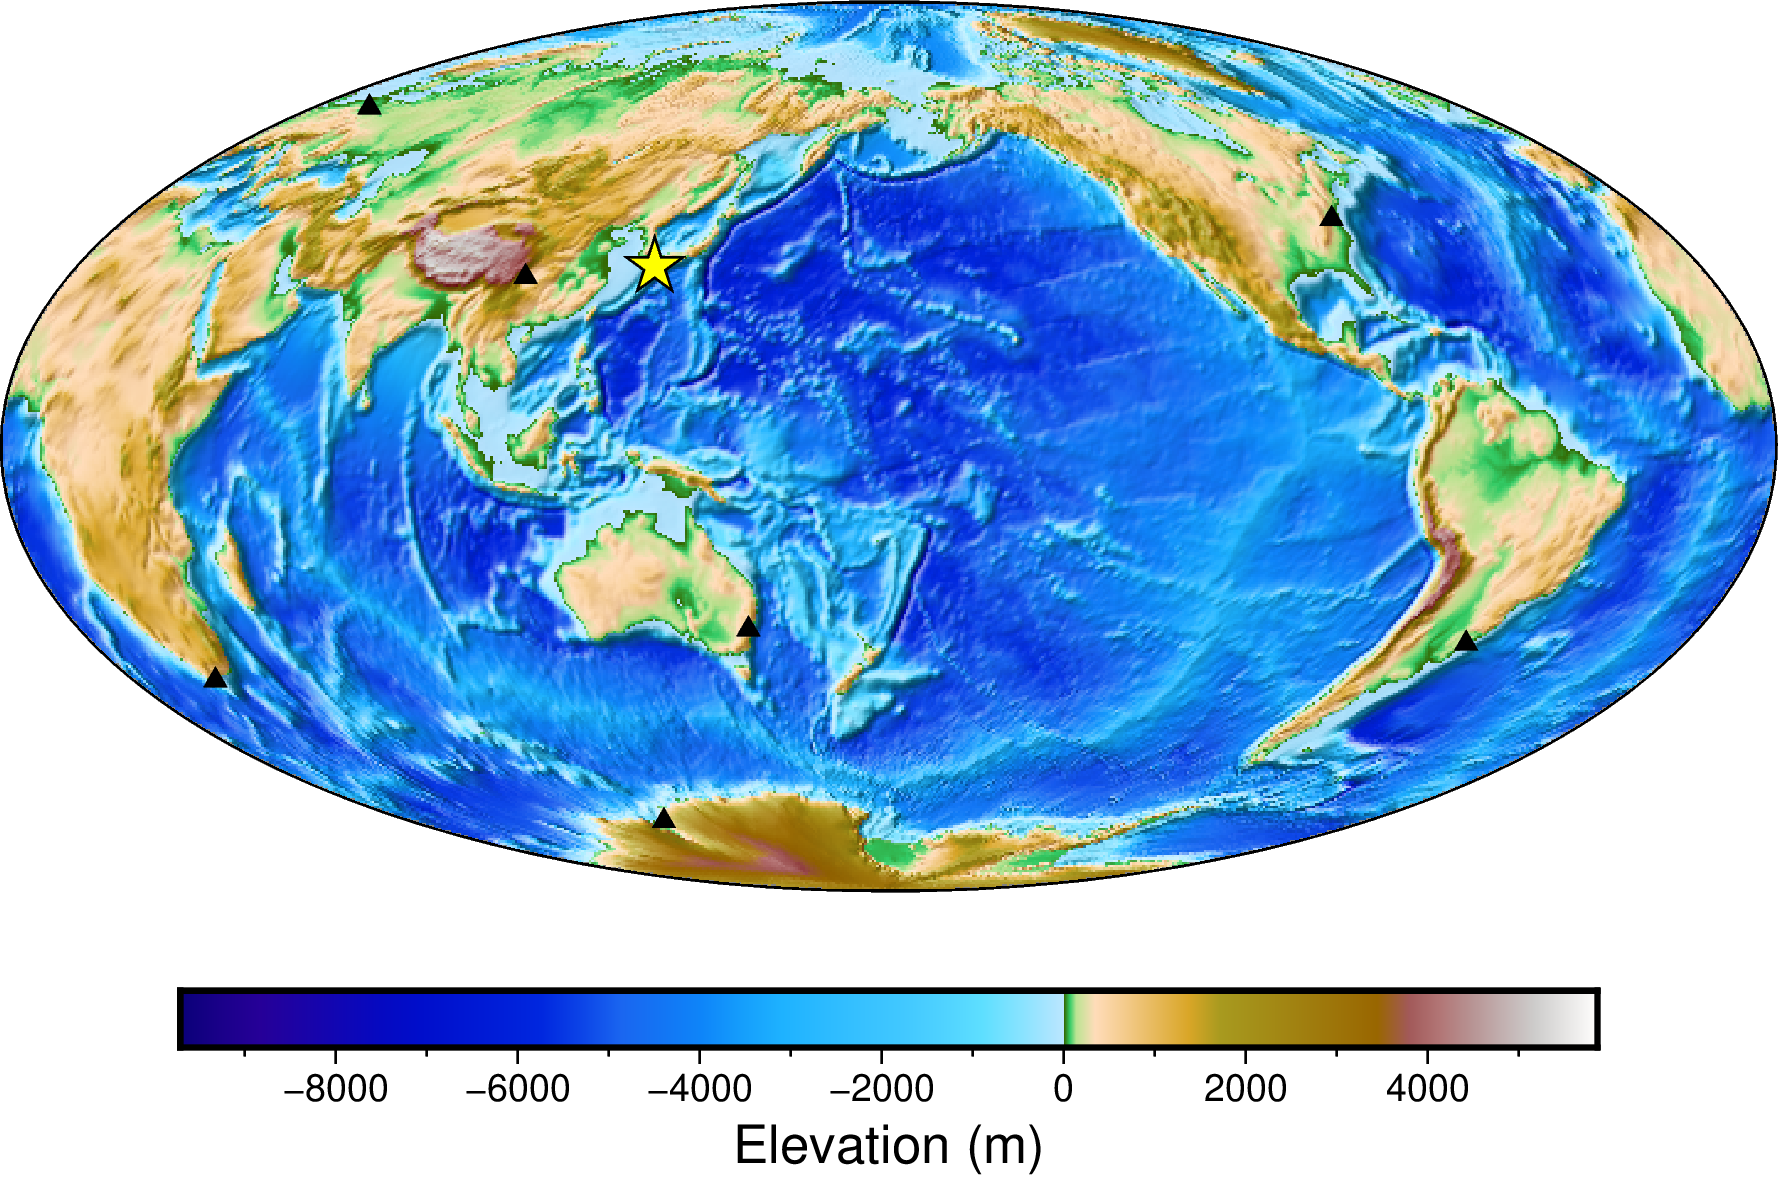
绘制震中和台站位置
接下来,使用 plot 模块绘制五角星和三角形。
#!/usr/bin/env bash
gmt begin layers

# Plot basemap and Earth relief
gmt basemap -JH180/15c -Rg -B0
gmt grdimage @earth_relief_30m -Cetopo1 -I+d
gmt colorbar -Bxa2000f+l"Elevation (m)"

# Plot epicenter
gmt plot -Sa0.5c -W0.5p,black,solid -Gyellow << EOF
130.72 32.78
EOF

# Plot station locations
gmt plot -St0.2c -W0.5p,black,solid -Gblack << EOF
104.39 29.90
13.14 52.50
19.99 -34.52
-77.15 38.89
-52.47 -31.62
150.36 -33.79
76.22 -69.22
EOF

gmt end show
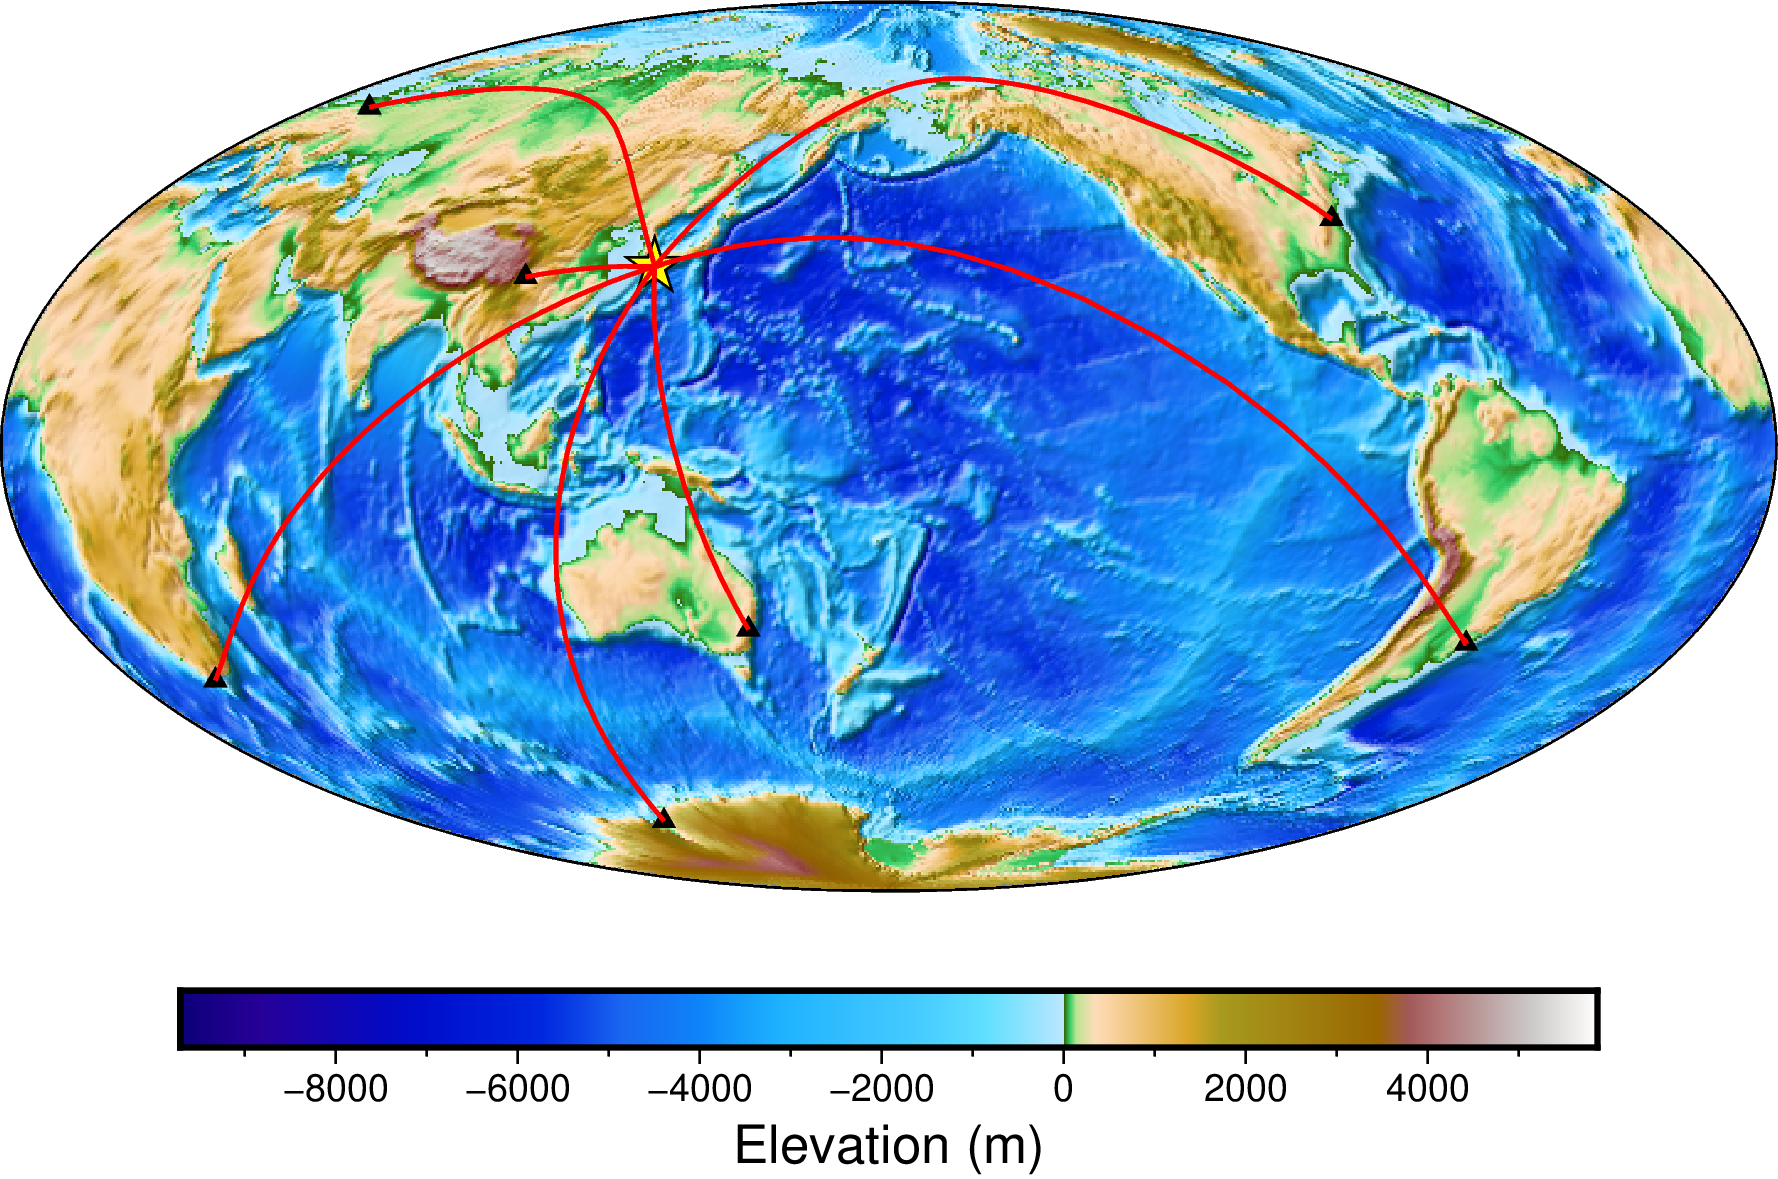
绘制射线路径
再使用 plot 模块绘制线段。默认情况下,plot 会自动用大圆路径连接地球上的两个位置,因而我们只需要用 > 分隔多个线段,每个线段给定两个坐标点(即地震位置和台站位置)即可。
#!/usr/bin/env bash
gmt begin layers

# Plot basemap and Earth relief
gmt basemap -JH180/15c -Rg -B0
gmt grdimage @earth_relief_30m -Cetopo1 -I+d
gmt colorbar -Bxa2000f+l"Elevation (m)"

# Plot epicenter
gmt plot -Sa0.5c -W0.5p,black,solid -Gyellow << EOF
130.72 32.78
EOF

# Plot station locations
gmt plot -St0.2c -W0.5p,black,solid -Gblack << EOF
104.39 29.90
13.14 52.50
19.99 -34.52
-77.15 38.89
-52.47 -31.62
150.36 -33.79
76.22 -69.22
EOF

# Plot great-circle path
gmt plot -W1p,red << EOF
>
130.72 32.78
104.39 29.90
>
130.72 32.78
13.14 52.50
>
130.72 32.78
19.99 -34.52
>
130.72 32.78
-77.15 38.89
>
130.72 32.78
-52.47 -31.62
>
130.72 32.78
150.36 -33.79
>
130.72 32.78
76.22 -69.22
EOF

gmt end show
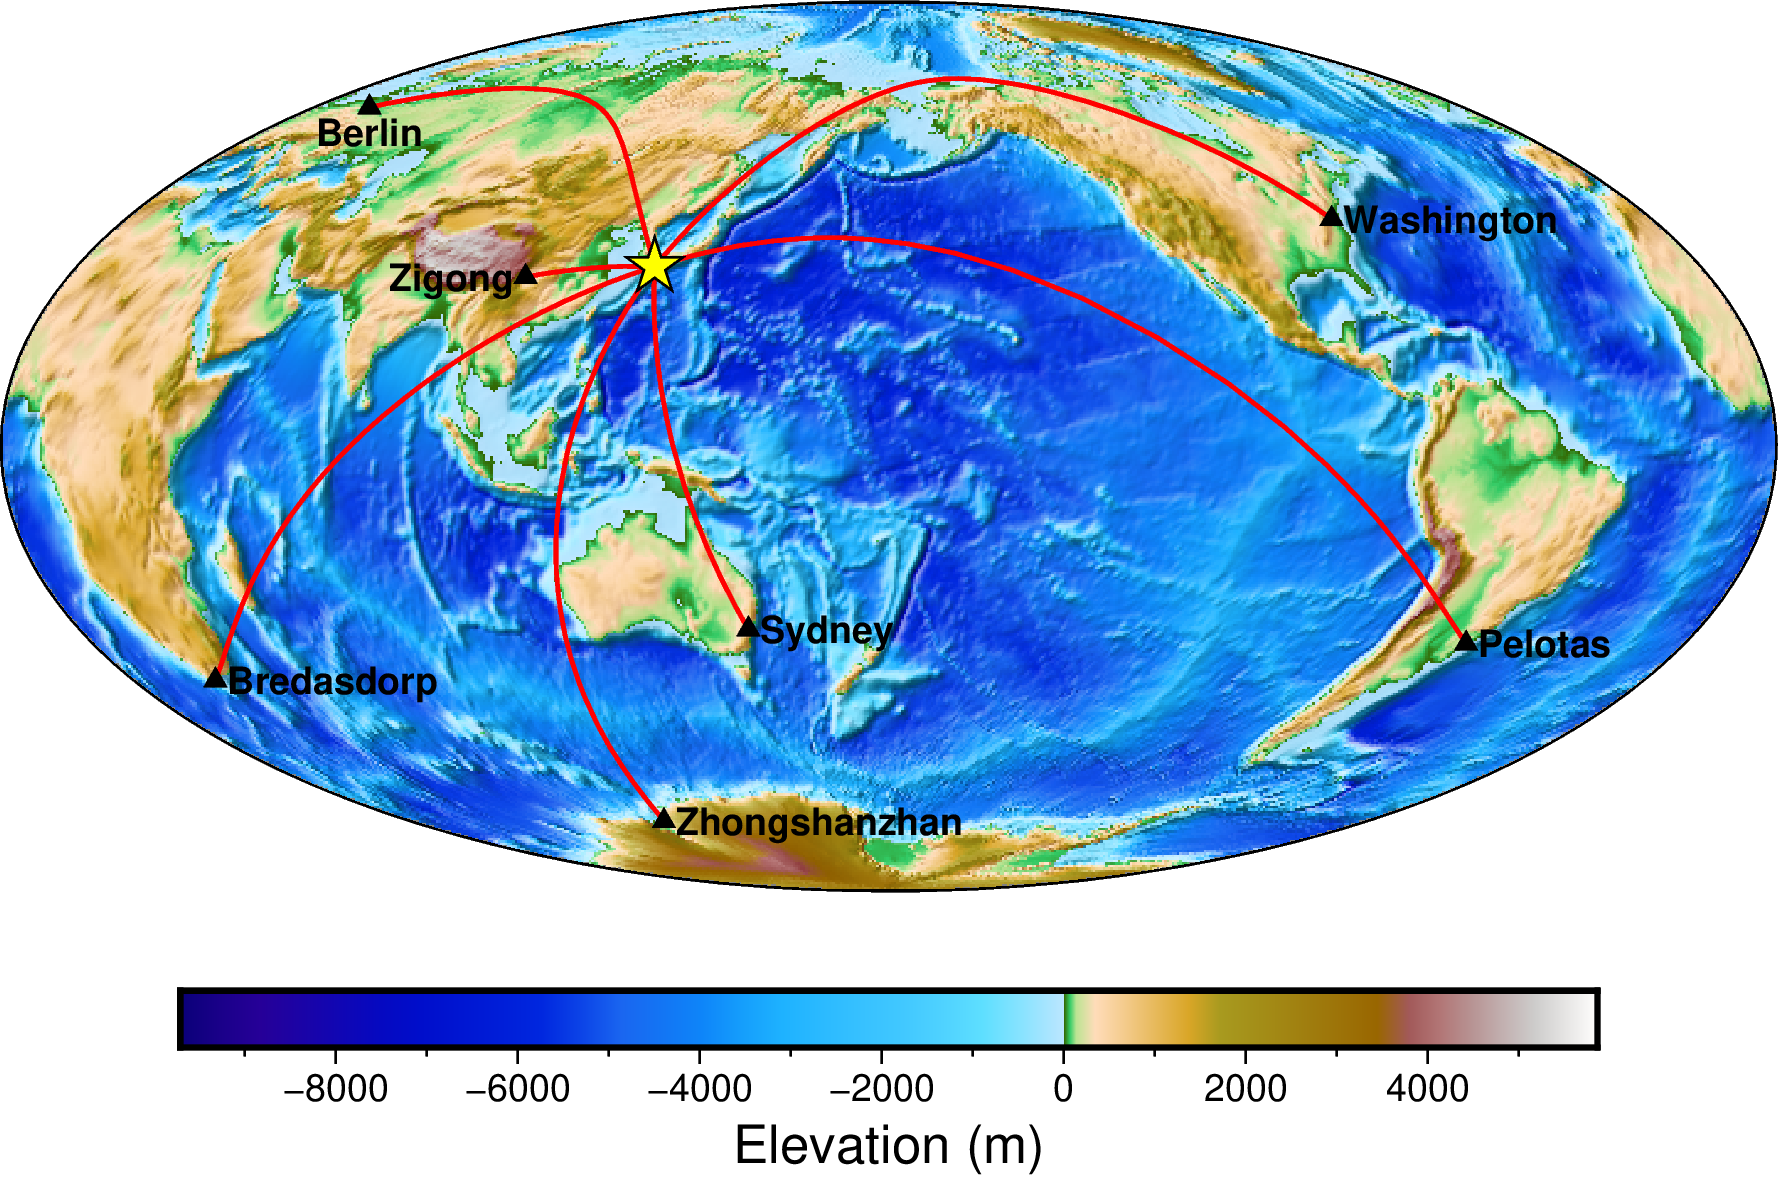
添加台站名
最后还需要往图画里添加台站所在地区的名字。添加文字使用 text 模块。这里我们使用了 -F+f9p,1,black+j 选项,因而输入数据是 4 列:
X Y 对齐方式 TEXT
-Dj0.1c/0.1c 则是将文本在对齐方式的基础上做进一步的偏移以避免文字覆盖线段或符号。
#!/usr/bin/env bash
gmt begin layers

# Plot basemap and Earth relief
gmt basemap -JH180/15c -Rg -B0
gmt grdimage @earth_relief_30m -Cetopo1 -I+d
gmt colorbar -Bxa2000f+l"Elevation (m)"

# Plot epicenter
gmt plot -Sa0.5c -W0.5p,black,solid -Gyellow << EOF
130.72 32.78
EOF

# Plot station locations
gmt plot -St0.2c -W0.5p,black,solid -Gblack << EOF
104.39 29.90
13.14 52.50
19.99 -34.52
-77.15 38.89
-52.47 -31.62
150.36 -33.79
76.22 -69.22
EOF

# Plot great-circle path
gmt plot -W1p,red << EOF
>
130.72 32.78
104.39 29.90
>
130.72 32.78
13.14 52.50
>
130.72 32.78
19.99 -34.52
>
130.72 32.78
-77.15 38.89
>
130.72 32.78
-52.47 -31.62
>
130.72 32.78
150.36 -33.79
>
130.72 32.78
76.22 -69.22
EOF

# Add text
gmt text -F+f9p,1,black+j -Dj0.1c/0.1c << EOF
-77.15  38.89 ML Washington
76.22  -69.22 ML Zhongshanzhan
104.39  29.90 MR Zigong
13.14   52.50 TC Berlin
19.99  -34.52 ML Bredasdorp
150.36 -33.79 ML Sydney
-52.47 -31.62 ML Pelotas
EOF

gmt end show

图层的先后顺序
上面的绘图脚本已经基本绘制出我们最初想要的图件了。细细看会发现,还有一些不完美的地方:比如黄色五角星和三角形被线段盖住了。
这是因为,GMT 的每一个绘图命令都会产生一个图层,后绘制的图层会覆盖在先绘制的图层的上面,即后来者居上。解决办法也很简单,先绘制线段,再绘制三角形和五角星即可。
对脚本中命令的先后顺序进行微调,如下所示:
#!/usr/bin/env bash
gmt begin layers

# Plot basemap and Earth relief
gmt basemap -JH180/15c -Rg -B0
gmt grdimage @earth_relief_30m -Cetopo1 -I+d
gmt colorbar -Bxa2000f+l"Elevation (m)"

# Plot great-circle path
gmt plot -W1p,red << EOF
>
130.72 32.78
104.39 29.90
>
130.72 32.78
13.14 52.50
>
130.72 32.78
19.99 -34.52
>
130.72 32.78
-77.15 38.89
>
130.72 32.78
-52.47 -31.62
>
130.72 32.78
150.36 -33.79
>
130.72 32.78
76.22 -69.22
EOF

# Plot epicenter
gmt plot -Sa0.5c -W0.5p,black,solid -Gyellow << EOF
130.72 32.78
EOF

# Plot station locations
gmt plot -St0.2c -W0.5p,black,solid -Gblack << EOF
104.39 29.90
13.14 52.50
19.99 -34.52
-77.15 38.89
-52.47 -31.62
150.36 -33.79
76.22 -69.22
EOF

# Add text
gmt text -F+f9p,1,black+j -Dj0.1c/0.1c << EOF
-77.15  38.89 ML Washington
76.22  -69.22 ML Zhongshanzhan
104.39  29.90 MR Zigong
13.14   52.50 TC Berlin
19.99  -34.52 ML Bredasdorp
150.36 -33.79 ML Sydney
-52.47 -31.62 ML Pelotas
EOF

gmt end show
这样我们就通过组合一系列简单的 GMT 命令,得到了一个复杂的 GMT 图件。